
The SPOT User Guide: Section 5 - Claims
Claim Status
The Claim Status feature allows users to check the status of their claims. Allow two to three business days for claims to appear in SPOT after being submitted.
Due to the nature of the systems source, the Claim Status query, as well as the information available, will differ based upon the provider’s line of business (i.e., Part A or Part B).
Note: Data updates to the SPOT application occur between 6-7:30 a.m. each weekday. Users may experience slower response times to claim and payment data queries or an interruption in access during these time periods.
Claim Status: Part A
To access claims information for a Part A provider, please take the following steps:
- Select Claims from the top menu.
- Select Claim Status from the submenu.
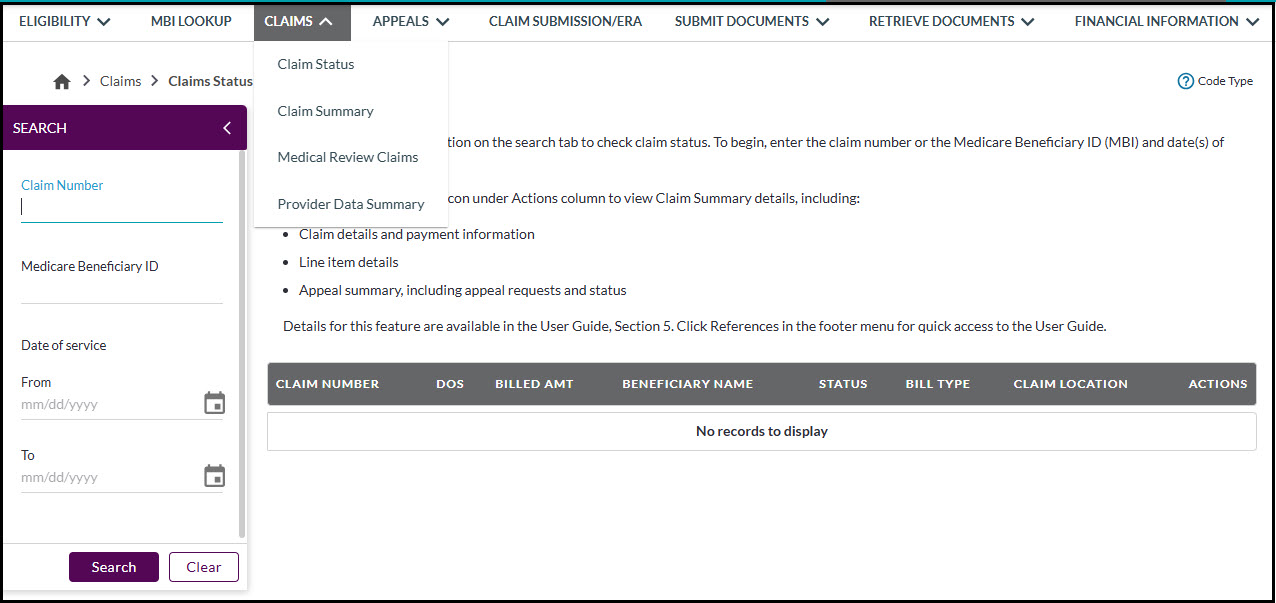
Figure 1: Part A – Claim Status
- Complete the required fields in the search menu on the left. To begin, enter the date(s) of service. To narrow your search results, enter the beneficiary’s Medicare ID and / or claim number / Document Control Number (DCN).
- Part A claim status information will be accessible for up to 12 months from the processed date.
- Click Search.
- Click the Claim Summary icon under the Actions column to view additional details regarding a particular claim.
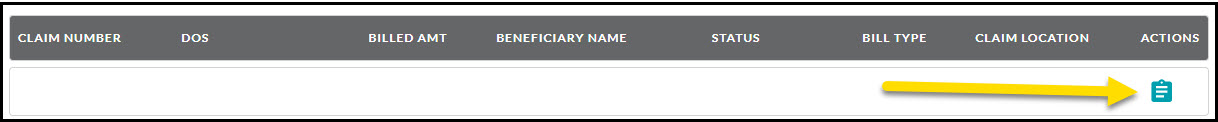
Figure 2: Part A – Claim Summary icon
The claim summary page includes tabs for Claim Summary, Claim Detail Lines, and Appeal Summary data.
Claim Summary
- Click on the various icon submenu to access additional claims data such as patient information, claim information, physician information, insured information, payer details, insurer information, MSP details, codes, and remark details.
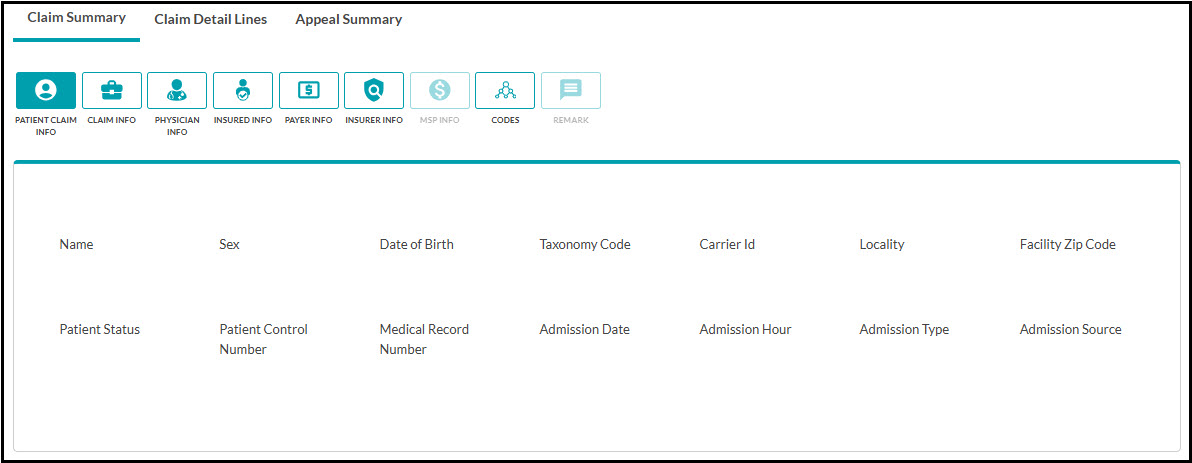
Figure 3: Part A – Claim Summary
Claim detail lines
- Click the Claim detail lines tab title to view the detail lines.
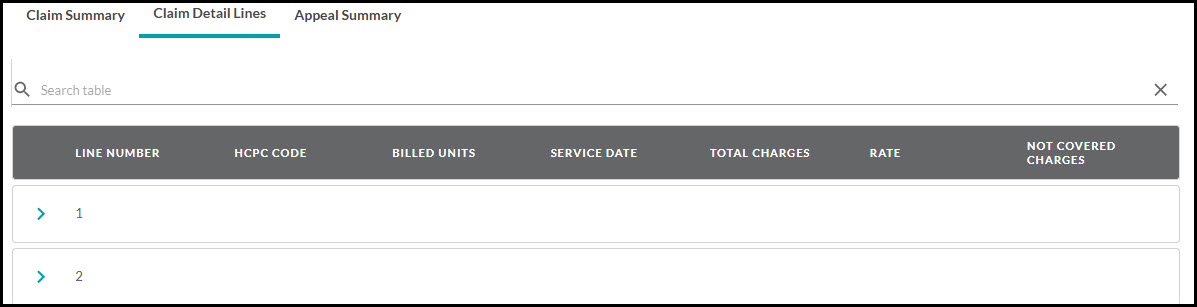
Figure 4: Part A – Claim Detail Lines
- Click the arrow in front of the line number to display additional line-item details.

Figure 5: Part A – Claim Detail Lines Additional Details
Appeal summary
- Click the Appeal summary tab title to view any appeal information available for the claim. When applicable, you can view appeal status, request a level-one appeal (redetermination), a level-two appeal (reconsideration), and download decision letters from the action column of this screen.
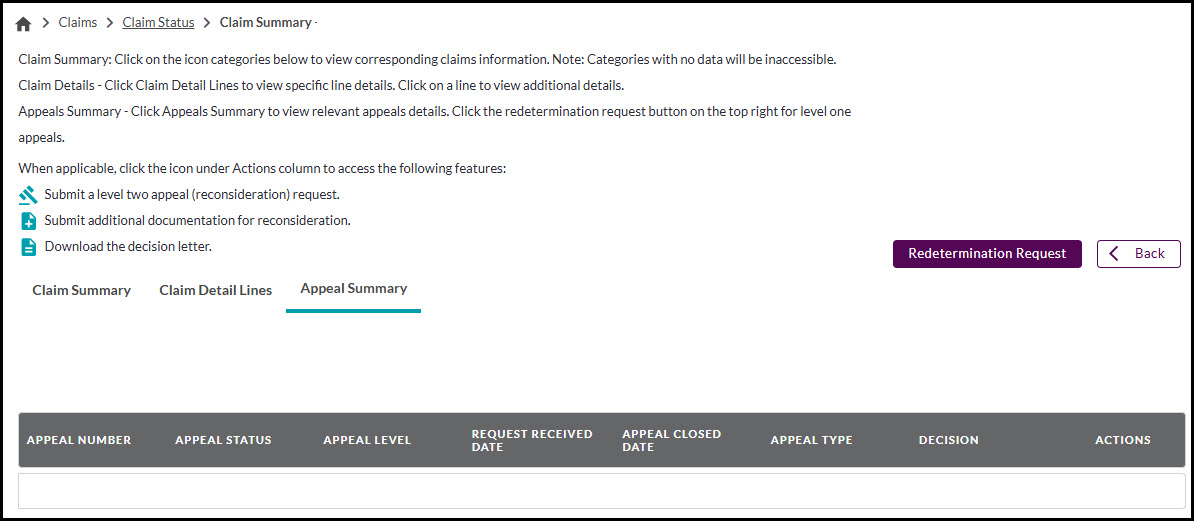
Figure 6: Part A – Appeal Summary
Continue to section six of the SPOT User Guide for information on how to submit appeals.
Part A redetermination requests
The Redetermination Request button is available here to start the appeal request (redetermination) process. The L2 request link is also available from this screen for applicable claims to submit a level two appeal (reconsideration). Refer to section six of the SPOT User Guide for continued instructions on these features.
Claim status: Part B
Note: The claim status feature is not currently available for dental providers.
To access claims information for a Part B provider:
- Select Claims from the top menu.
- Select Claim status from the submenu.
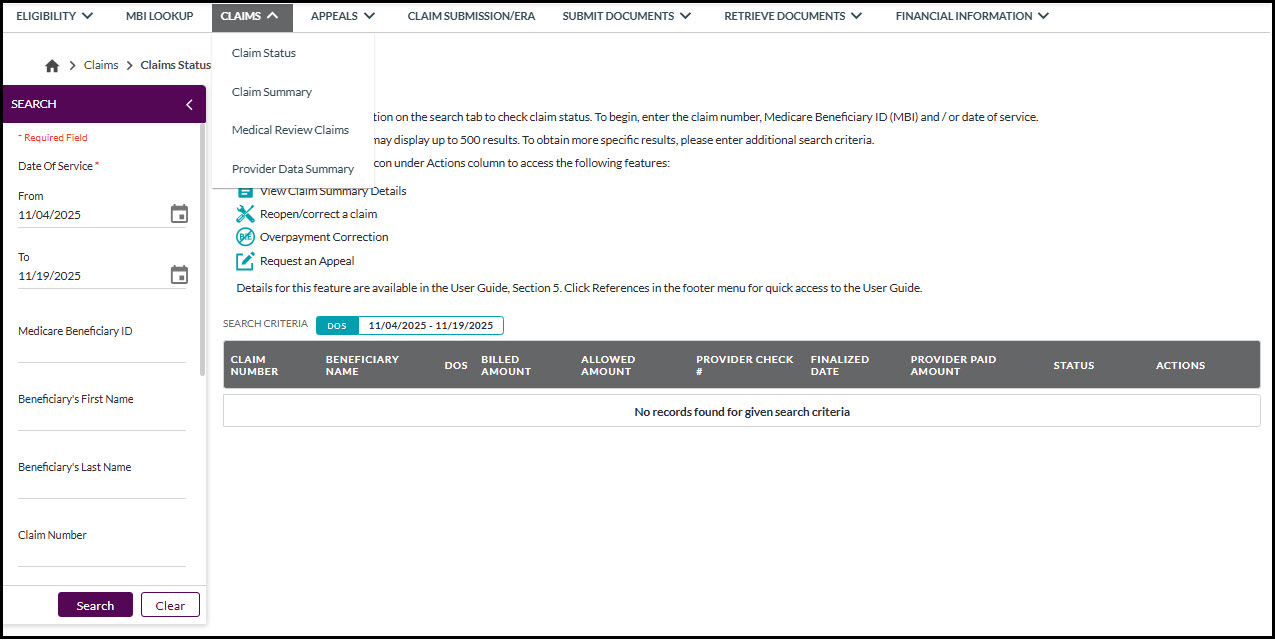
Figure 7: Part B – Claim Status
- Complete the required fields in the search menu on the left. To conduct a claim status search, begin by entering the date(s) of service. To narrow your search results, enter the beneficiary’s Medicare ID and / or claim number / Internal Control Number (ICN). Additional search options, such as beneficiary name, finalized date, and status.
-
Click Search.
Part B claim status information will be accessible for up to 12 months from the finalized date.
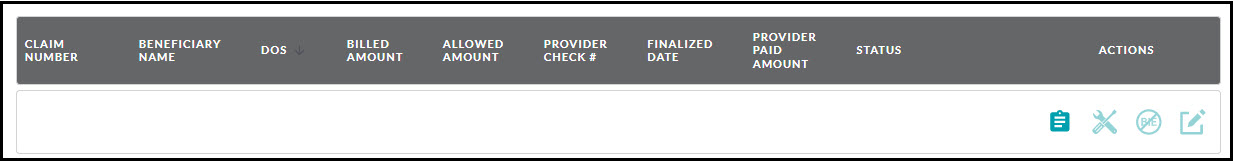
Figure 8: Part B – Claim Status results
-
To view additional details regarding a particular claim, click on the Claims Summary icon in the under the Actions column.
The claim status summary page includes header and line details.
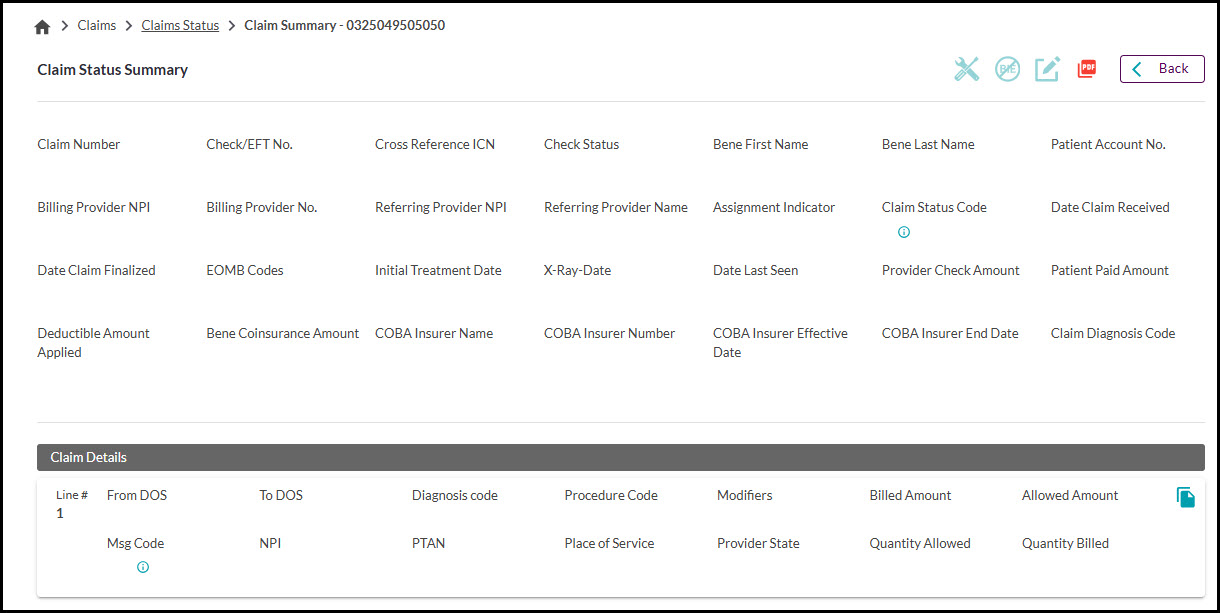
Figure 9: Part B – Claim Status Summary
- From the header section you may click the icons on the top right to access additional features. If the claim is ineligible for a certain feature, the icon will be grayed out. Reminder: Claims that are in a pending or adjusted status are ineligible for claim reopening.
- Click on the corresponding icon, when available, to access these features:
- Reopen / correct a claim
- Overpayment correction (Billed in error)
- Appeal request
For instructions on each of these features, continue to section six of the SPOT User Guide
- To return to Claim Status Results, click the Back button.
Claim summary
The claim summary screen provides the current claim data for the provider being reviewed. To access claim summary:
- Select Claims from the top menu.
- Click Claim summary from the submenu.
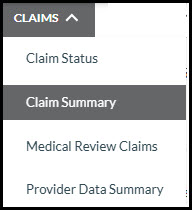
Figure 10: Claims menu
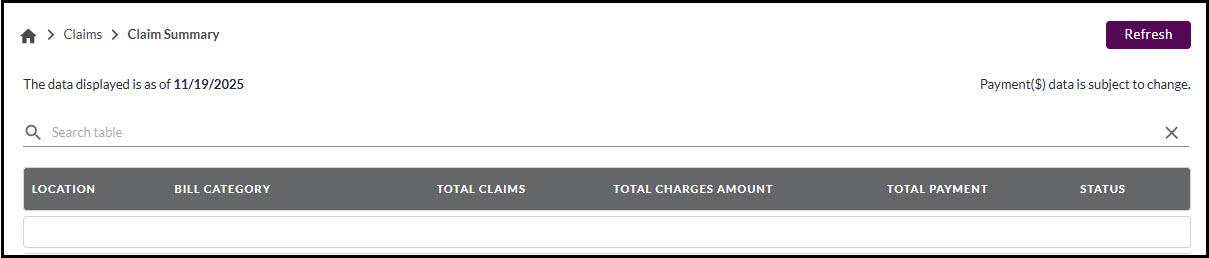
Figure 11: Part A – Claim Summary
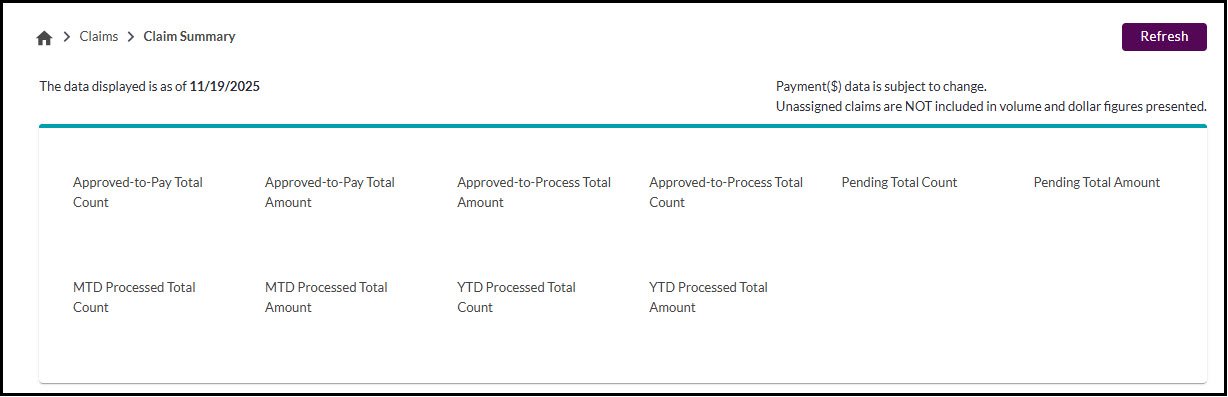
Figure 12: Part B – Claim Summary
Medical Review claims
The Medical Review (MR) claims feature provides status and details of claims related to medical review.
To check the status of MR-related claims:
- Select Claims from the top menu.
- Click Medical Review Claims from the submenu.
- Using the search tab on the left, complete the required fields. At least one field must be completed.
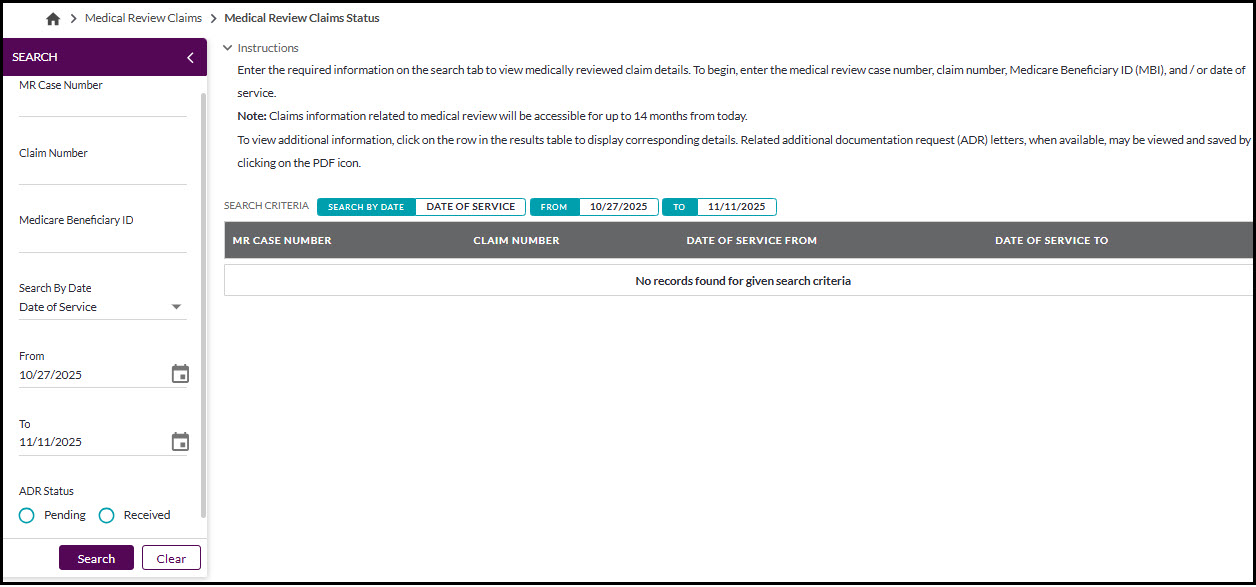
Figure 13: MR Claims Status
- Click Search.
Results will appear, showing MR case number, claim number and date of service From and To.
- Click on the arrow in front of the line to view more details. Available information includes ADR review, and education, details.
- Click the PDF icon under ADR letter, when applicable, to view your ADR letter.
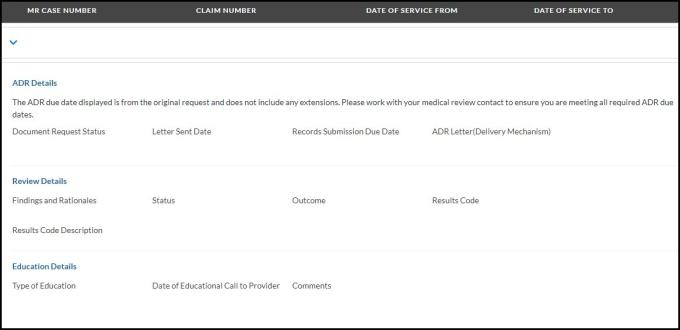
Figure 14: ADR Details
Provider Data Summary (PDS)
This feature offers users the opportunity to request a customized Provider Data Summary (PDS). The PDS is a free comprehensive billing report that helps identify potential Medicare billing issues through a detailed analysis of billing patterns in comparison with those of similar provider types. This report will assist in enhancing the accuracy and efficiency of your Medicare billing process.
To utilize the Data Reports - PDS Request feature:
- Select Claims from the top menu.
- Select Provider Data Summary from the submenu.
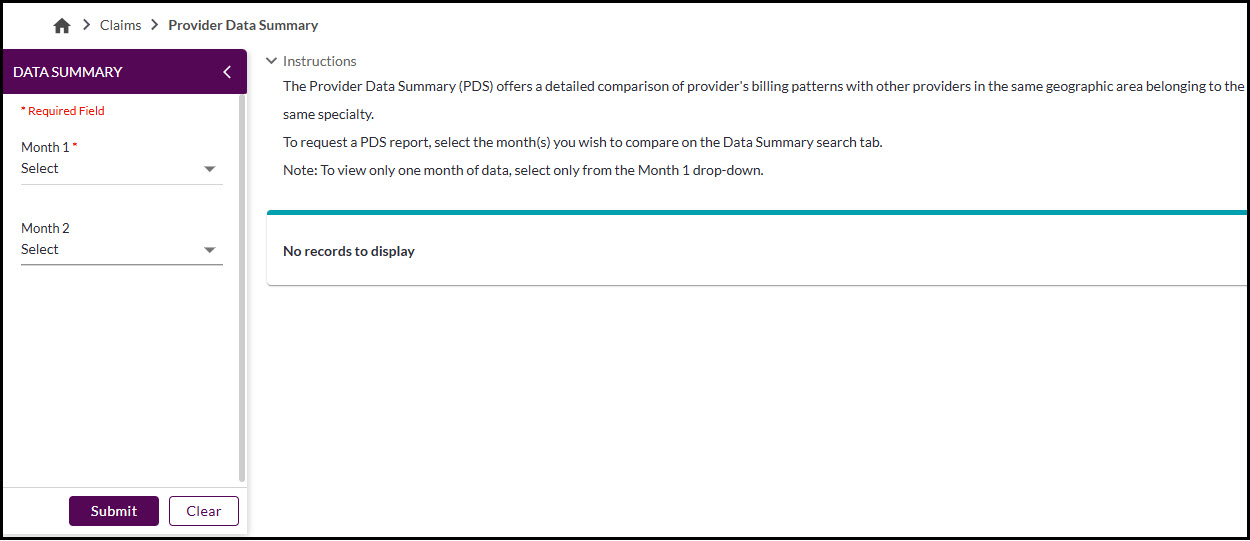
Figure 15: Part A – PDS Request Page
- Using the search tab on the left, select your desired dates from Month 1 and Month 2. You may view one month or compare two months within the 12 previous months from the current date.
- Click Submit.
- Review the PDS report. Claims Summary and Claims Outcome Summary tabs are available.
- Click the PDF icon button to download your report.
PDS Request: Part A
The PDS report for Part A helps facilities identify recurring billing issues through a detailed analysis of its billing patterns in comparison with those of similar facility types during a specified time.
Overview of PDS report - Part A
The PDS report for Part A providers is comprised of two main sections: Claim Summary and Claim Outcome Summary.
Claim summary - contains the comparative data compiled from claims that were finalized over the designated report period for the provider as well as those for the provider’s peer group. Peers are all individuals located in the provider’s geographic area that belong to the same facility type.
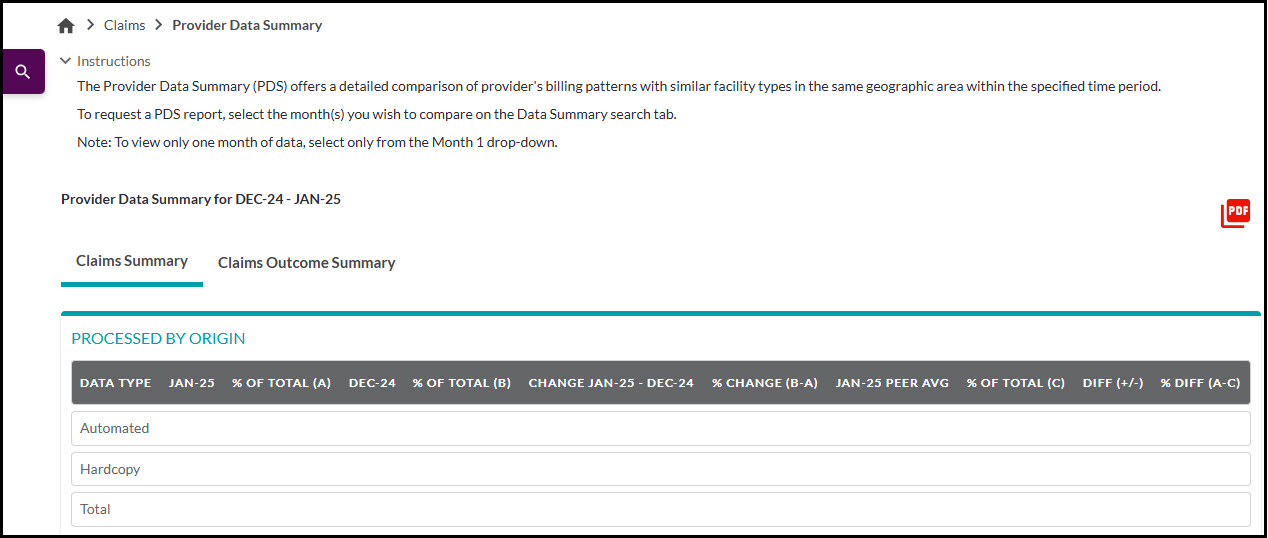

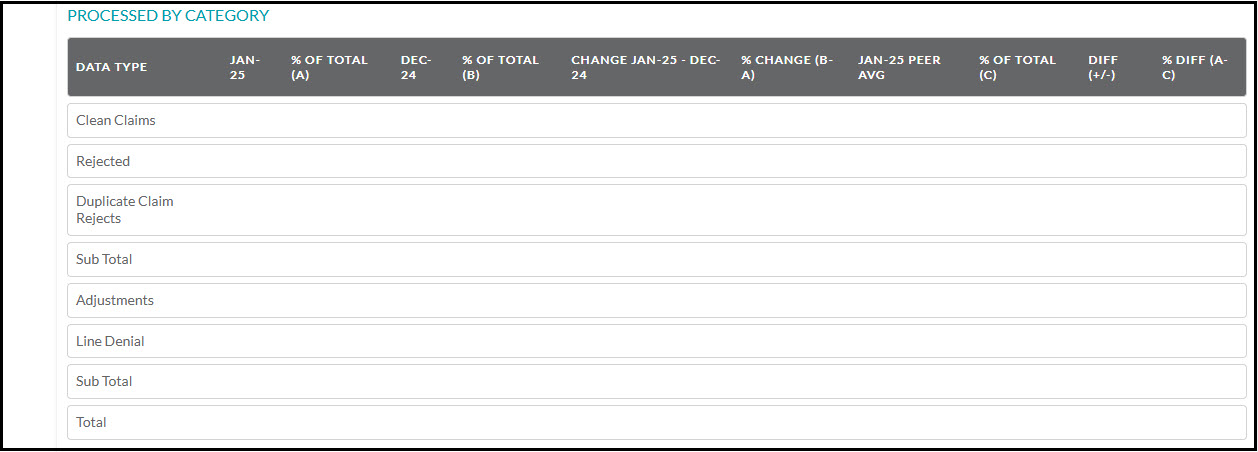

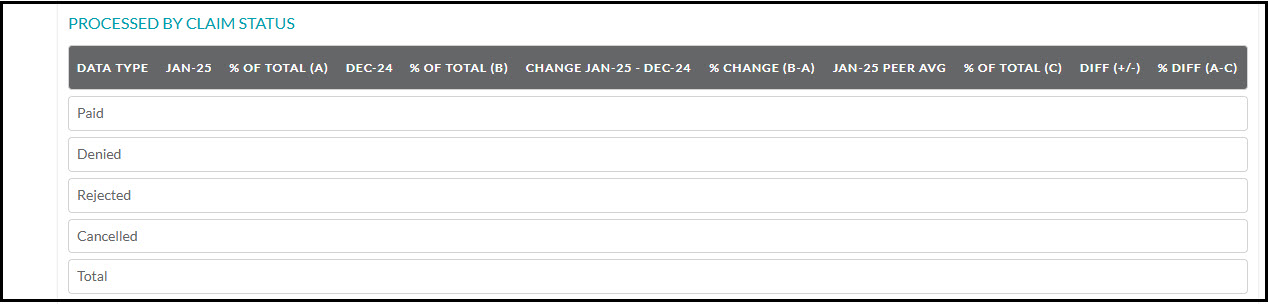
Figure 16: Part A – PDS Claims Summary
PDS Report - Part A: Claim summary overview
| Report identifier | Description |
|---|---|
|
Data category: Processed by origin (Location: Column one) |
Data includes comparisons of volumes and percentages of claims that were submitted by the facility or by peer facilities electronically (i.e., “Automated”) or as paper claims (i.e., “Hard copy”) during the specified time. |
|
Data category: Processed by place of service (Location: Column one) |
Data includes comparisons of volumes and percentages of claims processed - organized by place of service (e.g., “Inpatient Part A,” “Hospital Based or Inpatient (Part B),” “Outpatient”) - for services billed by the facility or by peer facilities during the specified time. |
|
Data category: Processed by category (Location: Column one) |
Data includes comparisons of volumes and percentages of claims - organized by processing category - (i.e., “Clean Claims,” “Rejected,” “Duplicate Claim Rejects,” “Adjustments,” “Line Denials”) for services billed by the facility or by peer facilities during the specified time. |
|
Data category: Processed by DTR (Location: Column one) |
Data includes comparisons of volumes and percentages of the timeframe (e.g., “0-15 days,” “61-90 days,” “over 180 days”) - between the date of service and the date processed - for claims submitted by the facility or by peer facilities during the specified time. |
|
Data category: Processed by claim status (Location: Column one) |
Data includes comparisons of volumes and percentages of claims - organized by claim status - (i.e., “Paid,” “Denied,” “Rejected,” “Canceled”) for services billed by the facility or by peer facilities during the specified time. |
|
Data category: RTP (Location: Column one) |
Data includes comparisons of volumes and percentages of automated and hard copy claims - submitted by the facility or by the peer facilities during the specified time - that were returned to provider (RTP). |
|
Data category: Processed by origin Data type: Automated (Location: Column two) |
The number / percentage of claims that were submitted by the facility or by peer facilities electronically (i.e., “Automated”) during the specified time. |
|
Data category: Processed by origin Data type: Hard copy (Location: Column two) |
The number / percentage of claims that were submitted by the facility or by peer facilities as paper claims (i.e., “Hard copy”) during the specified time. |
|
Data category: Processed by origin Data type: Total (Location: Column two) |
The total number / percentage of claims that were submitted by the facility or by peer facilities during the specified time. |
|
Data category: Processed by place of service Data type: Varies (Location: Column two) |
Specific data types (e.g., “Inpatient Part A,” “Outpatient”, “Other Part B”) - based on place of service - may vary from month to month and from facility to facility. In this section, comparative data (volumes and percentages) will be presented based upon the classification of claims (based on place of service) that were submitted by the facility or by peer facilities during the specified time. |
|
Data category: Processed by category Data type: Clean claims (Location: Column two) |
The volume / percentage of claims - submitted by the facility or by peer facilities during the specified time - that processed successfully. |
|
Data category: Processed by category Data type: Rejected claims (Location: Column two) |
The volume / percentage of claims - submitted by the facility or by peer facilities during the specified time - that were rejected. |
|
Data category: Processed by category Data type: Duplicate claims (Location: Column two) |
The volume / percentage of claims - submitted by the facility or by peer facilities during the specified time - that were duplicates (i.e., submitted more than once). |
|
Data category: Processed by category Data type: Adjustments (Location: Column two) |
The volume / percentage of claims - submitted by the facility or by peer facilities during the specified time - that processed after the claims were adjusted. |
|
Data category: Processed by category Data type: Line denials (Location: Column two) |
The volume / percentage of services - billed by the facility or by peer facilities during the specified time - that were denied in the claims submitted. |
|
Data category: Processed by category Data type: Total (Location: Column two) |
The total number / percentage of claims that were submitted by the facility or by peer facilities during the specified time. |
|
Data category: Processed by DTR Data type: Date ranges (Location: Column two) |
Data includes comparisons of volumes and percentages of the timeframe (e.g., “0-15 days,” “61-90 days,” “over 180 days”) - between the date of service and the date processed - for claims submitted by the facility or by peer facilities during the specified time. |
|
Data category: Processed by claim status Data type: Paid claims (Location: Column two) |
The volume / percentage of claims - submitted by the facility or by peer facilities during the specified time - that were paid. |
|
Data category: Processed by claim status Data type: Denied claims (Location: Column two) |
The volume / percentage of claims - submitted by the facility or by peer facilities during the specified time - that were denied. |
|
Data category: Processed by claim status Data type: Rejected claims (Location: Column two) |
The volume / percentage of claims - submitted by the facility or by peer facilities during the specified time - that were rejected. |
|
Data category: Processed by claim status Data type: Canceled claims (Location: Column two) |
The volume / percentage of claims - submitted by the facility or by peer facilities during the specified time - that were canceled by the submitter. |
|
Data category: Processed by claim status Data type: Total (Location: Column two) |
The total number / percentage of claims that were submitted by the facility or by peer facilities during the specified time. |
|
Data category: RTP Data type: Automated (Location: Column two) |
The number / percentage of claims - submitted by the facility or by peer facilities electronically (i.e., “Automated”) during the specified time period that were returned to provider (RTP). |
|
Data category: RTP Data type: Hard copy (Location: Column two) |
The number / percentage of claims - submitted by the facility or by peer facilities as paper claims (i.e., “Hard copy”) - during the specified time period that were returned to provider (RTP). |
|
Data category: RTP Data type: Total (Location: Column two) |
The total number / percentage of claims - submitted by the facility or by peer facilities during the specified time - that were returned to provider (RTP). |
|
FEB12 (i.e., Month 1) (Location: Column three) |
Facility’s data - from all six data categories - that pertain to the first month listed. |
|
% of total (A) (Location: Column four) |
Facility’s data - percentages of claim volumes (from all six data categories) - for the first month listed. |
|
MAR12 (i.e., Month 1) (Location: Column five) |
Facility’s data - from all six data categories - that pertain to the second month listed. |
|
% of total (B) (Location: Column six) |
Facility’s data - percentages of claim volumes (from all six data categories) - for the second month listed. |
|
Change FEB12-MAR12 (i.e., Month 1-Month 2) (Location: Column seven) |
Comparison of facility’s data - from all six data categories - volume changes between the first and second months listed. |
|
% Change (B-A) (Location: Column eight) |
Comparison of facility’s data - percentage changes in claim volumes (all six categories) - between the first and second months listed. |
|
FEB12 PEER AVERAGE (Location: Column nine) |
Averages of peer group’s data - from all six data categories - that pertain to the first month listed. |
|
% of total (C) (Location: Column 10) |
Peer group’s data (averages) - percentages of claim volumes (from all six data categories) - for the first month listed. |
|
Diff (+/-) (Location: Column 11) |
Comparison of facility and peer group’s data - differences between the facility and the peer group’s claim volumes (from all six data categories) during the specified time. |
|
% Diff (A-C) (Location: Column 12) |
Comparison of facility and peer group’s data - percentage changes in claim volumes (all six categories) - between the facility and the peer group’s data. |
Claim outcome summary - contains a list of adjustment codes, reject codes, line denial codes, and returned to provider (RTP) codes - organized by place of service (e.g., inpatient Part A, inpatient Part B) and claim type (i.e., automated, hard copy) - that impacted the provider’s claims during the specified reporting period. The table also includes data regarding the number of claims affected.
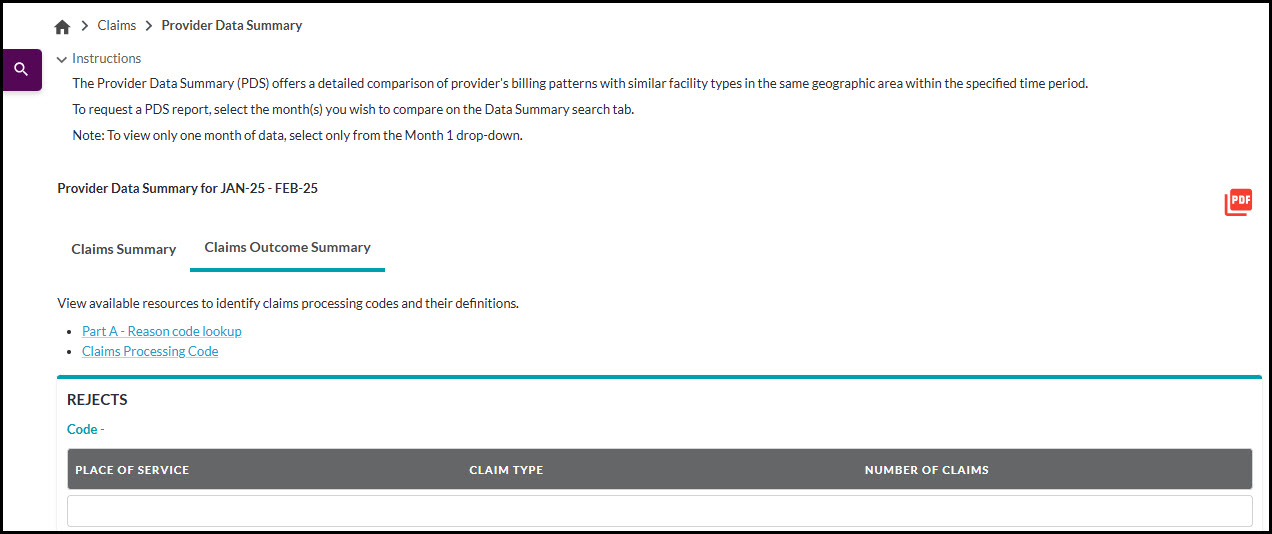
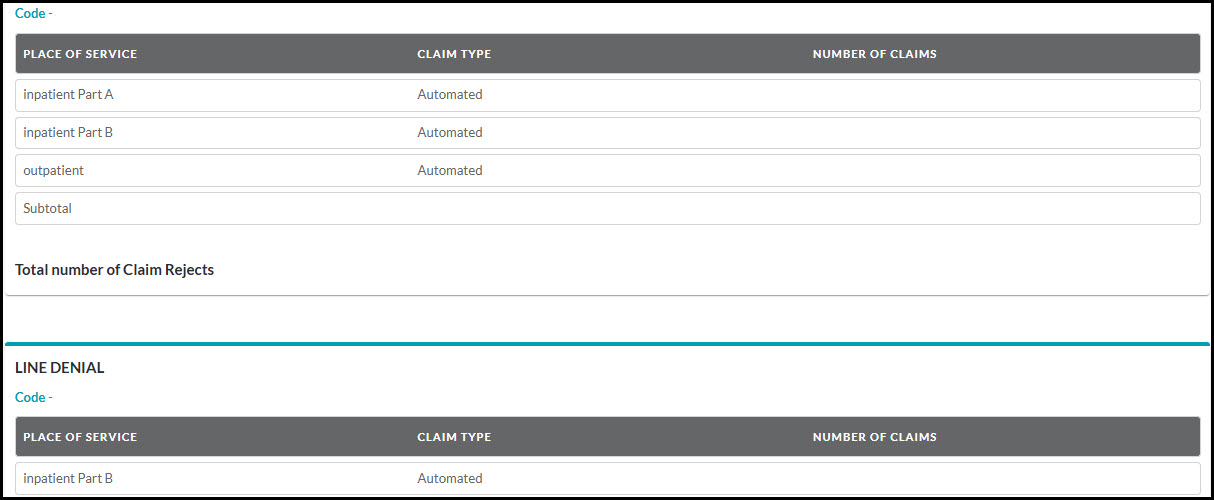
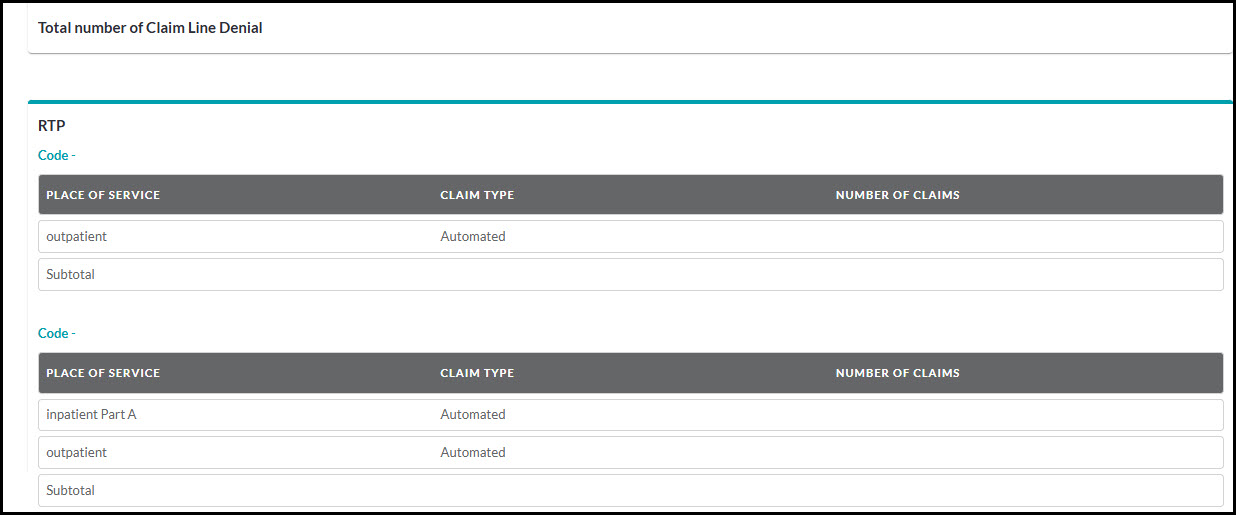
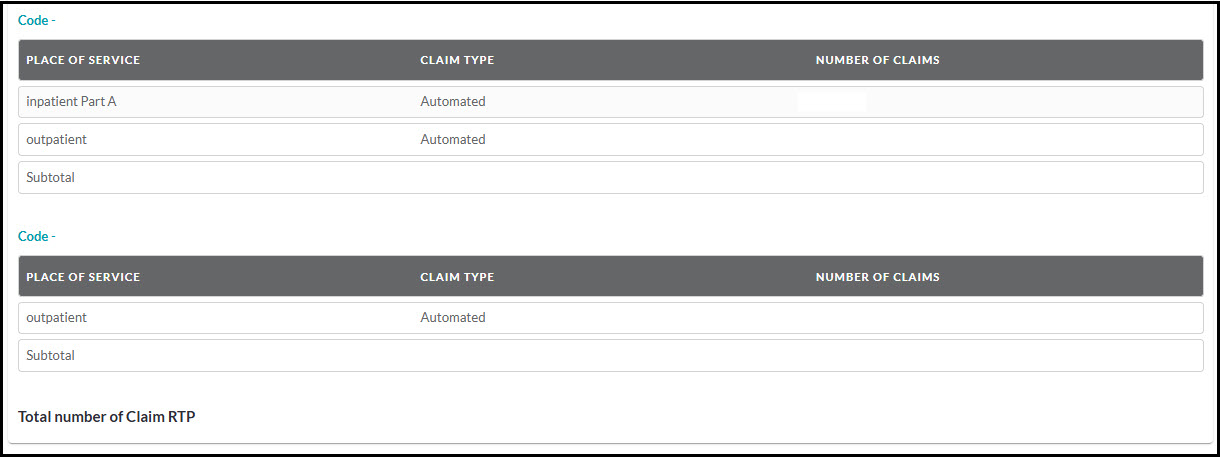
Figure 17: Part A - PDS Request Message Code Table
Specific categories of codes (e.g., “Adjustments,” “Rejects”, “Line denials,” “RTP”) - organized by place of service and claim type - may vary from month to month. To review the most common inquiries received by the provider contact center and learn how to increase the number of claims that process successfully, please refer to First Coast’s Claims resources page.
PDS Request: Part B
The PDS report for Part B providers helps identify recurring billing issues through a detailed analysis of its billing patterns in comparison with those of similar provider types during a specified time.
The PDS report for Part B providers is comprised of two main sections: Claims Summary and Claims Count by Message Code.
Claim summary - contains the comparative data compiled from claims that were finalized over the designated report period for the provider as well as those for the provider’s peer group. Peers are all individuals located in the provider’s geographic area that belong to the same specialty or facility type.
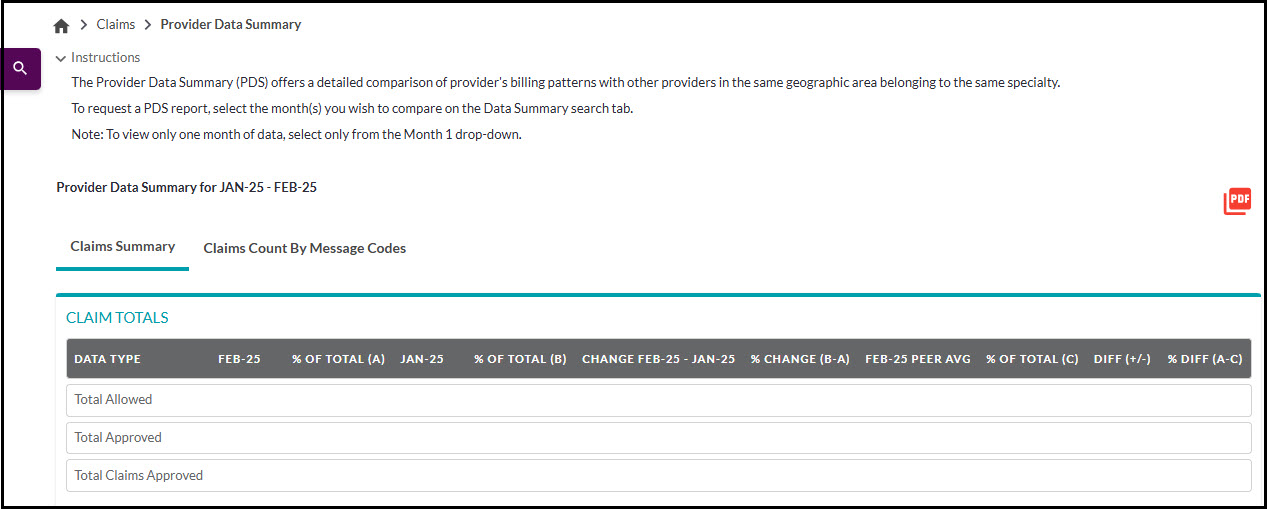
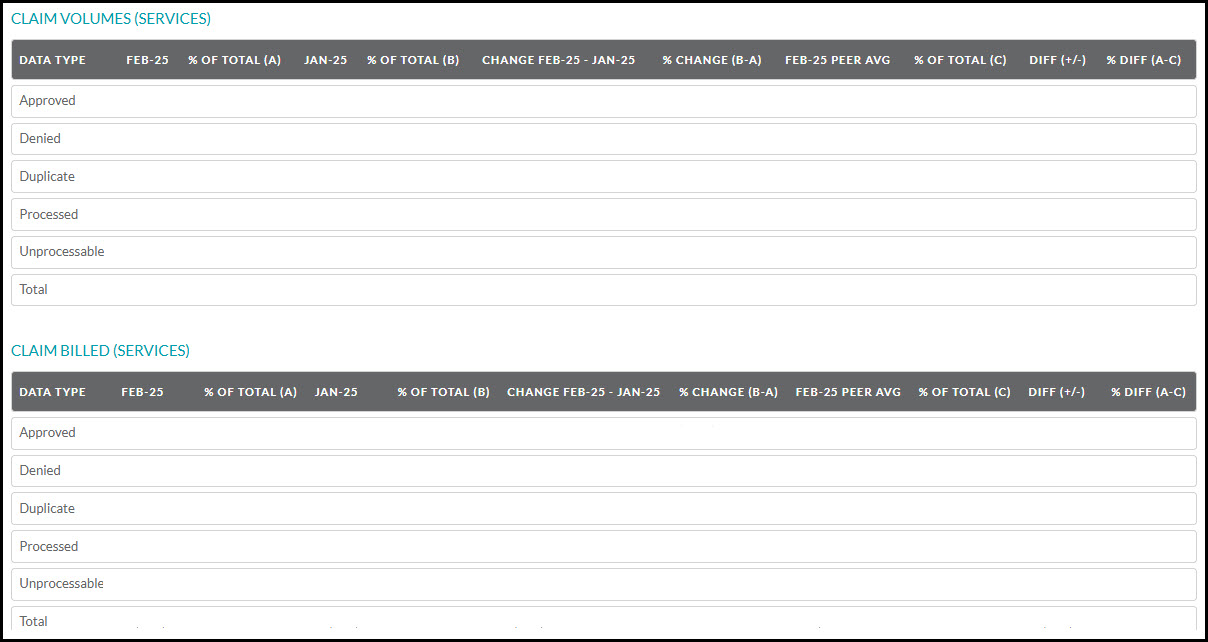
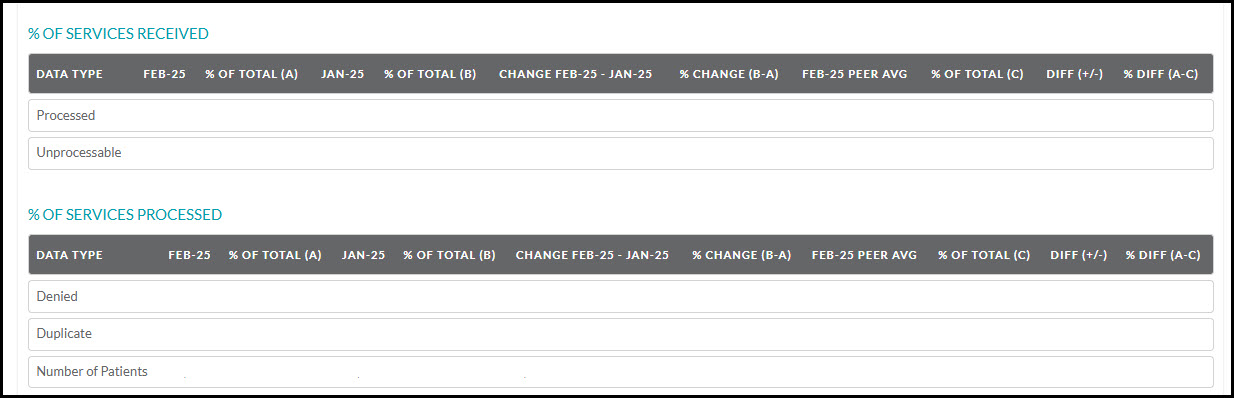
Figure 18: Part B – PDS Claims Summary
PDS Report: Part B - Claim summary overview
| Report identifier | Description |
|---|---|
|
Data category: Claim Totals (Location: Column one) |
Data includes comparisons of total amounts (in dollars) of allowed and approved claims as well as the total number of claims approved for services billed by the provider or the provider’s peers during the specified time. |
|
Data category: Claim Volumes (Services) (Location: Column one) |
Data includes comparisons of volumes and percentages of services in claims designated as paid, denied, duplicate, processed (subtotal), and returned as unprocessable (RUC) that were submitted by the provider or the provider’s peers during the specified time. |
|
Data category: Claim Billed Dollars (Location: Column one) |
Data includes comparisons of dollar amounts and percentages of services billed in claims submitted by the provider or the provider’s peers during the specified time. |
|
Data category: % of Services Received (Location: Column one) |
Data includes comparisons of percentages of services billed in claims that were processed or returned as unprocessable (RUC) and were submitted by the provider or the provider’s peers during the specified time. |
|
Data category: % of Services Processed (Location: Column one) |
Data includes comparisons of percentages of denied or duplicate services billed in claims that were submitted by the provider or the provider’s peers during the specified time. |
|
Data category: Claim Totals Data type: Total Allowed $ (Location: Column two) |
The total amount (in dollars) that Medicare allowed for the specific services billed by the provider or the provider’s peers during the specified time. |
|
Data category: Claim Totals Data type: Total Approved $ (Location: Column two) |
The total amount (in dollars) of approved claims for services billed by the provider or the provider’s peers during the specified time. |
|
Data category: Claim Totals Data type: Total Claims Approved (Location: Column two) |
The total number of approved claims for services billed by the provider or the provider’s peers during the specified time. |
|
Data category: Claim Volumes (Services) Data type: Approved (Location: Column two) |
The total number / percentage of approved services billed in claims submitted by the provider or the provider’s peers during the specified time. |
|
Data category: Claim Volumes (Services) Data type: Denied (Location: Column two) |
The total number / percentage of denied services billed in claims submitted by the provider or the provider’s peers during the specified time. |
|
Data category: Claim Volumes (Services) Data type: Duplicate (Location: Column two) |
The total number / percentage of duplicate services billed in claims submitted by the provider or the provider’s peers during the specified time. |
|
Data category: Claim Volumes (Services) Data type: Subtotal (Processed) (Location: Column two) |
The total number / percentage of processed services billed in claims submitted by the provider or the provider’s peers during the specified time. |
|
Data category: Claim Volumes (Services) Data type: Unprocessable (Location: Column two) |
The total number / percentage of services billed in claims designated as returned as unprocessable (RUC) that were submitted by the provider or the provider’s peers during the specified time. |
|
Data category: Claim Volumes (Services) Data type: Total (Location: Column two) |
The total number / percentage of services billed by the provider or the provider’s peers during the specified time. |
|
Data category: Claim Billed Dollars (Services) Data type: Approved (Location: Column two) |
The total amount (in dollars) / percentage of approved services billed in claims submitted by the provider or the provider’s peers during the specified time. |
|
Data category: Claim Billed Dollars (Services) Data type: Denied (Location: Column two) |
The total amount (in dollars) / percentage of denied services billed in claims submitted by the provider or the provider’s peers during the specified time. |
|
Data category: Claim Billed Dollars (Services) Data type: Duplicate (Location: Column two) |
The total amount (in dollars) / percentage of duplicate services billed in claims submitted by the provider or the provider’s peers during the specified time. |
|
Data category: Claim Billed Dollars (Services) Data type: Subtotal (Processed) (Location: Column two) |
The total amount (in dollars) / percentage of processed services billed in claims submitted by the provider or the provider’s peers during the specified time. |
|
Data category: Claim Billed Dollars (Services) Data type: Unprocessable (Location: Column two) |
The total amount (in dollars) / percentage of services billed in claims that were submitted by the provider or the provider’s peers during the specified time and were returned as unprocessable (RUC). |
|
Data category: Claim Billed Dollars (Services) Data type: Total (Location: Column two) |
The total amount (in dollars) / percentage of services billed in claims submitted by the provider or the provider’s peers during the specified time. |
|
Data category: % of Services Received Data type: Processed (Location: Column one) |
The percentage of processed services billed in claims that were submitted by the provider or the provider’s peers during the specified time. |
|
Data category: % of Services Received Data type: Unprocessable (Location: Column one) |
The percentage of services billed in claims submitted by the provider or the provider’s peers during the specified time, but the claims were returned as unprocessable (RUC). |
|
Data category: % of Services Processed Data type: Denied (Location: Column one) |
The percentage of processed services billed in claims that were submitted by the provider or the provider’s peers during the specified time. |
|
Data category: % of Services Received Data type: Duplicate (Location: Column one) |
The percentage of services billed in claims submitted by the provider or the provider’s peers during the specified time period, but the claims were returned as unprocessable (RUC). |
| Number of patients | Number of beneficiaries for whom services were furnished by the provider or the provider’s peer group during the specified time. |
|
FEB12 (i.e., Month 1) (Location: Column three) |
Provider’s data - from all five data categories - that pertain to the first month listed. |
|
% of total (A) (Location: Column four) |
Provider’s data - percentages of claim volumes (services) and claim billed dollars (services) - for the first month listed. |
|
MAR12 (i.e., Month 2) (Location: Column five) |
Provider’s data - from all five data categories - that pertain to the second month listed. |
|
% of total (B) (Location: Column six) |
Provider’s data - percentages of claim volumes (services) and claim billed dollars (services) - for the second month listed. |
|
Change FEB12-MAR12 (i.e., Month 1-Month 2) (Location: Column seven) |
Comparison of provider’s data - from all five data categories - volume changes between the first and second months listed. |
|
% Change (B-A) (Location: Column eight) |
Comparison of provider’s data - percentage changes in claim volumes (services) and claim billed dollars (services) - between the first and second months listed. |
|
FEB12 PEER AVERAGE (Location: Column nine) |
Averages of peer group’s data - from all five data categories - that pertain to the first month listed. |
|
% of total (C) (Location: Column 10) |
Peer group’s data (averages) - percentages of claim volumes (services) and claim billed dollars (services) - for the first month listed. |
|
Diff (+/-) (Location: Column 11) |
Comparison of provider and peer group’s data - differences in claim volumes (services) and claim billed dollars (services) - between the provider and peer group’s data during the specified time. |
|
% Diff (A-C) (Location: Column 12) |
Comparison of provider and peer group’s data - percentage changes in claim volumes (services) and claim billed dollars (services) - between the provider and the peer group’s data. |
Claims count by message code - contains a list of top reason codes (and their associated descriptors) that caused the provider’s claims to be denied or returned as unprocessable (RUC) during the designated reporting period. The table also includes data on the frequency of their occurrence during the reporting period.
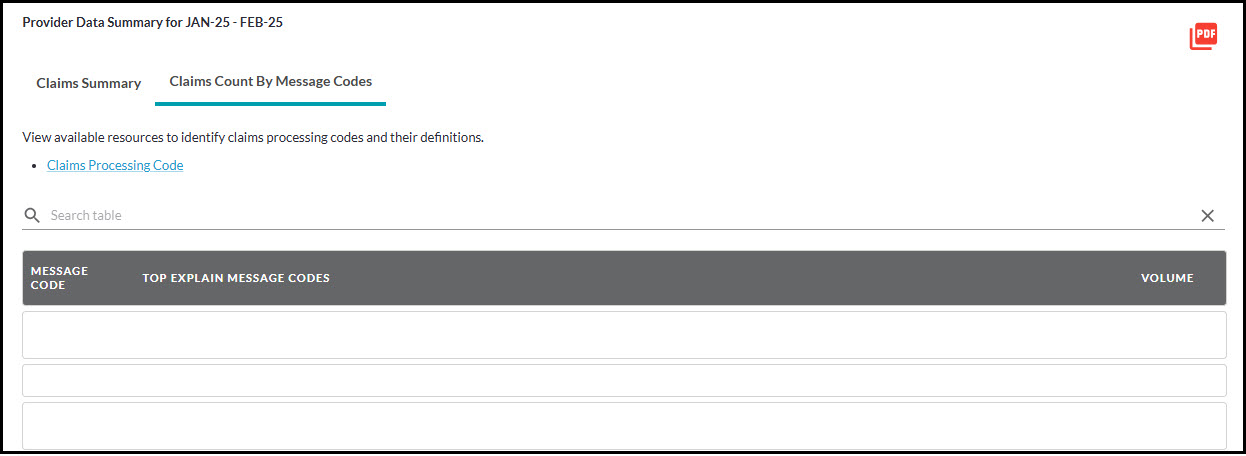
Figure 19: Part B – PDS Request Message Code Table
To review the most common inquiries received by the provider contact center and learn how to increase the number of claims that process successfully, please refer to First Coast’s Claims resources page.